OpenTelemetry Support for fast-agent
Getting Started
fast-agent supports OpenTelemetry, providing observability of MCP and LLM interactions. This is also a useful test/eval tool for comparing the behaviour of MCP Servers with different mixes of Tools, descriptions and models.
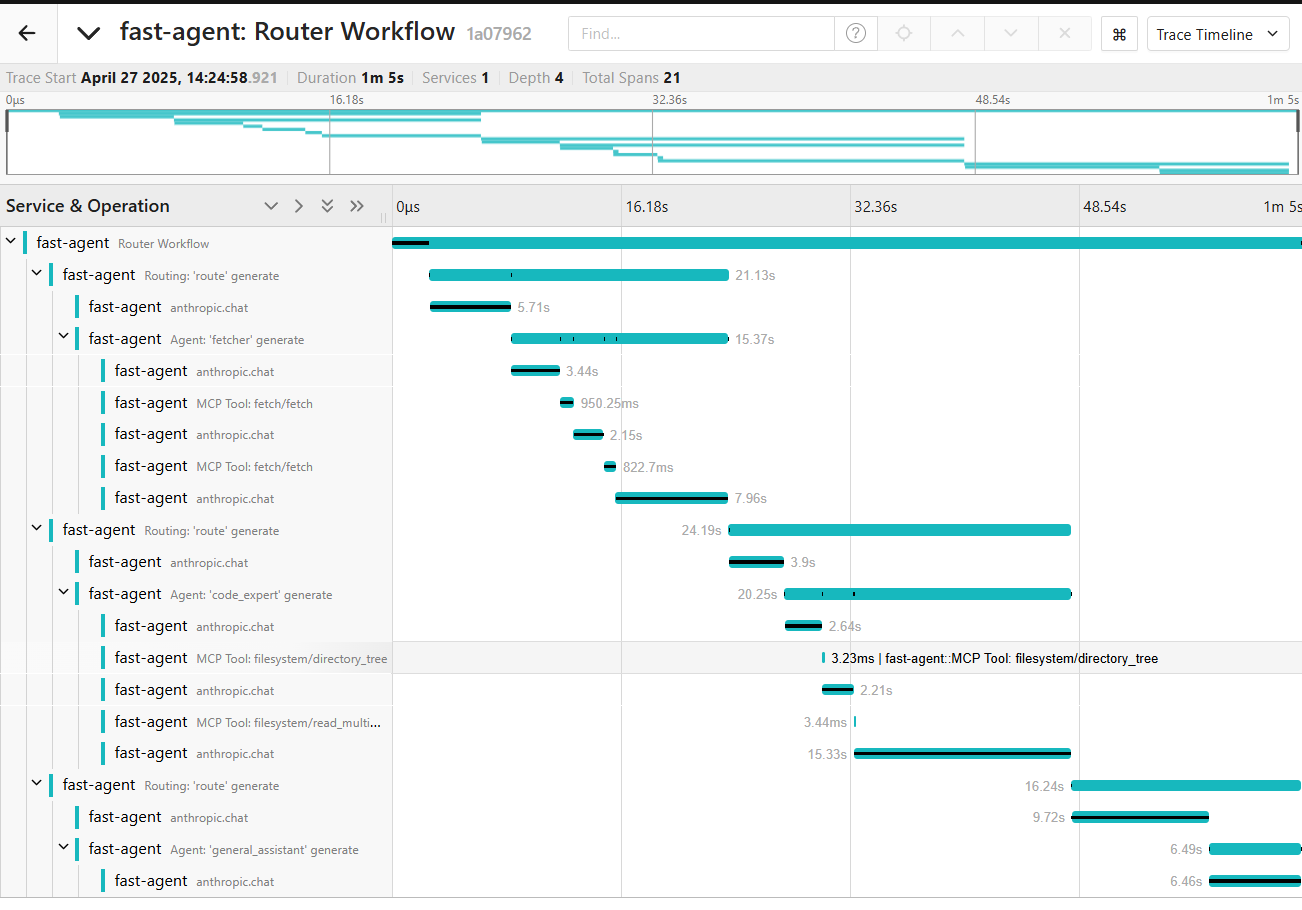
Set up an OpenTelemetry server
The first step is to set up an OpenTelemetry server. For this example, we will use Jaeger running locally with docker-compose.yaml. Create the following docker-compose file in a convenient directory:
services:
  jaeger:
    image: jaegertracing/jaeger:latest
    container_name: jaeger
    ports:
      - "16686:16686" # Web UI
      - "4318:4318" # OTLP HTTP

    restart: unless-stopped
Run docker-compose up to download and start the server. Navigate to http://localhost:16686 to access the Jaeger UI.
Configure fast-agent
Next, update your fast-agent.yaml to enable telemetry:
otel:
  enabled: true
  otlp_endpoint: "http://localhost:4318/v1/traces"  # This is the default value
Then, run your agent as normal - telemetry is transmitted by default to http://localhost:4318/v1/traces. From the Jaeger UI use the "Services" drop down to select fast-agent and click "Find Traces" to view the output.
OpenAI Responses WebSocket instrumentation
With the currently pinned OpenLLMetry OpenAI instrumentation
(opentelemetry-instrumentation-openai==0.62.1), Responses API calls using the
WebSocket transport produce fast-agent's agent and root spans, but not the detailed
openai.response provider span. To capture provider metadata such as model and
response IDs, token usage, and finish reasons, use the SDK-backed SSE transport by
adding transport=sse to the model string, for example
responses.gpt-5.6-terra?transport=sse.
For full configuration settings, check the configuration file reference